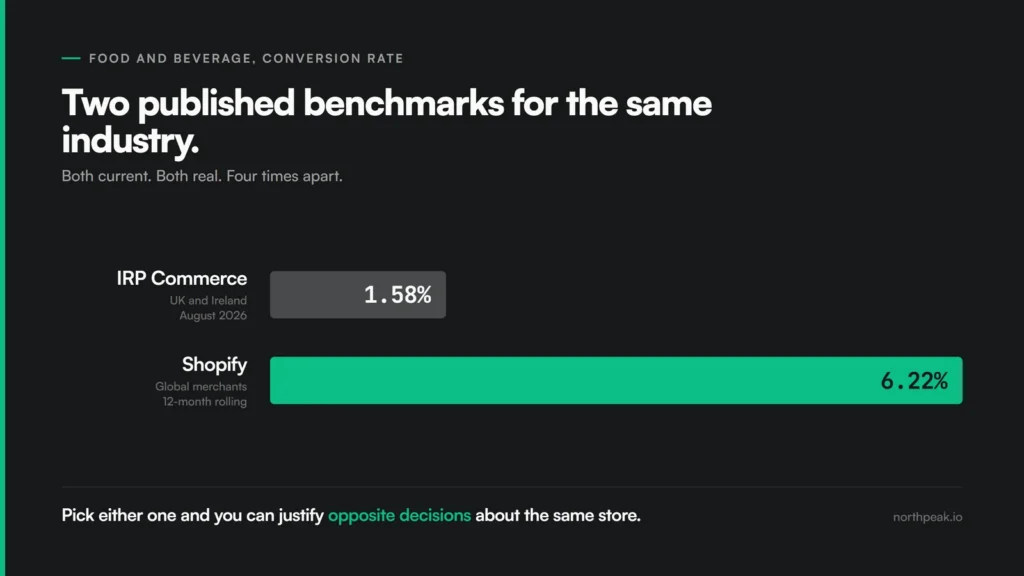
Ask what the average ecommerce conversion rate is, and two credible sources will give you different answers for the same food and drink store. IRP Commerce, measuring independent and mid-market merchants across the UK and Ireland, put it at 1.58% in August 2026. Shopify, working from a twelve-month rolling window across its own platform, puts food and beverage at 6.22%.
Both figures are real, both are current, and they describe the same industry. They’re almost four times apart.
A coffee brand can find either one inside ten minutes of searching. One of them says the business is performing normally. The other says it’s converting at a quarter of what it should be, which is the kind of number that starts a redesign, ends an agency relationship, or gets someone’s budget cut. Nothing about the store changes in between. Only which tab you happened to open.
That gap is the subject of this article, and the reason the question “what is a good conversion rate” has no useful answer in the form most people want it.
The average ecommerce conversion rate you came for
Littledata’s benchmark of 427 Shopify stores puts the median sitewide conversion rate at 1.4%, with the top 20% of those stores clearing 2.6% and the top 10% clearing 3.6%. IRP Commerce recorded 2.23% across all sectors in August 2026, up from 1.85% in the same month a year earlier.
So the average ecommerce conversion rate sits somewhere between 1.4% and 2.23%, depending on who you ask and, more importantly, who they asked.
Hold on to how wide that is. The distance between those two published averages is larger than the improvement most optimization programs deliver in a year, which means the benchmark you picked matters more to your self-assessment than anything you actually did to the site.
Every published average, with its scope attached
The whole problem fits in one table, and the interesting column is the one on the right.
| Source | Figure | What it actually measured |
|---|---|---|
| Littledata | 1.4% median | 427 Shopify stores, 90 days to 10 Oct 2026 |
| Littledata | 2.8% beauty / 0.9% home and furniture | Same stores, same window |
| IRP Commerce | 2.23% all sectors | UK and Ireland only, August 2026, roughly 30% of the independent merchant sector |
| IRP Commerce | 1.58% food and drink | Same dataset, near the bottom of its table |
| Shopify | 6.22% food and beverage | Twelve-month rolling, top of its table |
Nobody publishing these is being careless. Every one of them states its scope plainly on the page it came from. The scope simply falls off somewhere between the source and the slide, and what survives the journey is a decimal with nothing attached to it.
Why they disagree
Three things move a published benchmark far more than merchant quality does.
Who got sampled. IRP measures independent SME and mid-market merchants in the UK and Ireland. Littledata measures Shopify stores, which skew differently on category, price point and market. These are different businesses selling different things to different people, and averaging either population produces a number that describes that population and nothing else.
What counted as a conversion. IRP uses last-click attribution. Your GA4 property may well be counting sessions differently from your store admin right now, on the same traffic, on the same day, for reasons nobody at your company has ever sat down and reconciled. Most merchants are already carrying two conversion rates and have quietly picked whichever one they prefer.
When it was measured. Littledata reports a rolling ninety days. IRP reports a single named month. Shopify reports a twelve-month rolling window. Those are three different questions, and a twelve-month average quietly folds in a Black Friday that the ninety-day number may miss entirely. None of the three is wrong. They are simply not answers to the same question, and the vintage is the first thing that falls off when a figure gets quoted.
None of that scope travels with the number. What gets quoted as the average ecommerce conversion rate is a decimal that looks authoritative and says nothing about your store.
What a benchmark can’t tell you
A benchmark can tell you that other stores exist and roughly where they land. That’s the entire list of things it can do.
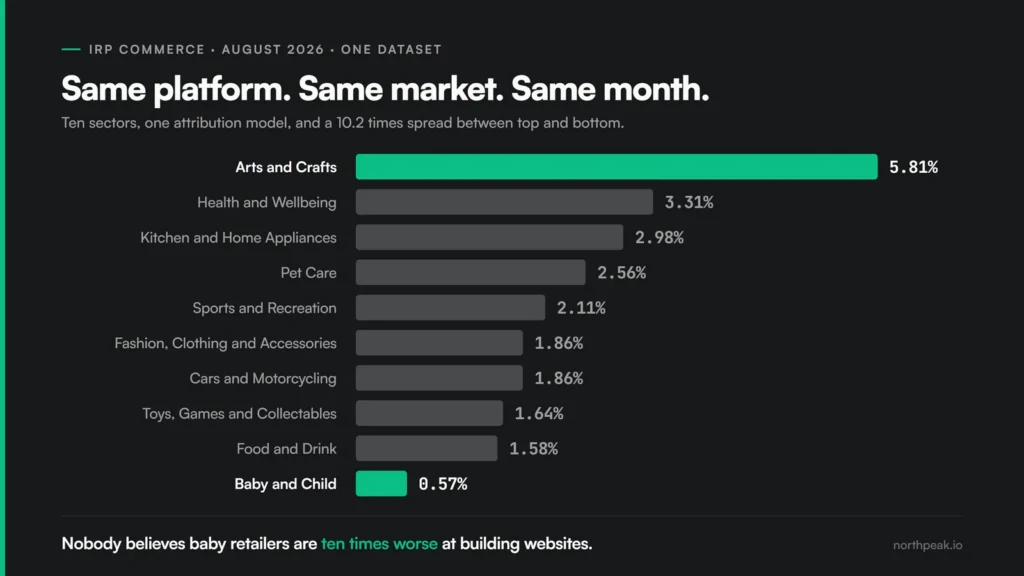
It can’t tell you whether your rate is a problem, because it knows nothing about your price point, traffic mix, category, return rate or margin. The clearest way to see this is to stop comparing across sources and look inside a single dataset, where the method, the market and the month are all held still.
In IRP’s August 2026 table, arts and crafts converts at 5.81% and baby and child converts at 0.57%. Nothing differs between those two figures except the category. They sit more than ten times apart.
Nobody seriously believes that baby retailers are ten times worse at building websites than craft shops. The gap is the category doing what categories do: what the product costs, how long people deliberate before buying it, and how much of the decision has already happened before anyone reaches the site.
This is also why ranking stores by conversion rate gets the order backwards more often than not. A store selling something considered and expensive will sit lower on every published table than a store selling impulse items, and can still earn several times more per visitor.
Most stores can’t measure the change they’re chasing
Picking the wrong benchmark costs you an afternoon. Chasing one you have no way of measuring costs you a quarter.
Suppose you read IRP’s 2.23% and your own store sits a few tenths of a point below it. You now want to close that gap, and the question nobody asks first is whether your store has enough traffic to tell the difference between a change that size and ordinary week-to-week noise.
What a real change costs to measure
Use a real test as the yardstick. On the Buy Truck Wheels project below, conversion went from 0.82% to 1.71% and it still took 56 days and 4,111 sessions on the tested pages before the result was solid enough to roll out. That change roughly doubled the rate. It was about as large as page-level changes get.
Now scale that down. A change a tenth of that size doesn’t need a tenth of the traffic. It needs vastly more, because the smaller the effect, the longer you have to watch to separate it from chance. A store doing a few thousand sessions a month is, in practice, unable to measure an improvement of two tenths of a point at all. It will see the number move, because the number always moves, and it will attribute that movement to whatever it happened to change that week.
This is how benchmark-chasing turns into folklore. A team makes a change, the rate drifts up, the change gets written down as a win and repeated on other pages, and nobody ever finds out that it did nothing.
The practical consequence is that low-traffic stores shouldn’t be running small tests at all. They should be making changes large enough to produce an effect they can actually see, or fixing things they already know are broken without testing them, which is a legitimate and underused option.
The number that does the job better
Revenue per session. Total revenue divided by sessions.
It beats conversion rate for one specific and unglamorous reason: it can’t be gamed by the things that quietly cost you money. You can lift a conversion rate by discounting, by dropping a free shipping threshold, or by removing a required field that was doing useful work filtering out bad orders. Every one of those moves the metric in the direction you wanted and can move the business in the opposite one.
Revenue per session prices all of that in. When a change lifts conversion and drops revenue per session, you haven’t won anything. You’ve found something out, which is worth more.
Then compare it against your own store last month, and the month before. That comparison is the only valid one available to you, because it’s the only one where everything except what you changed stayed roughly the same.
A store where the benchmark hid the problem
A client selling commercial truck wheels came to us because traffic was down. Paid had dropped 16% and organic was sliding with it, and the conversation they wanted to have was about ad spend.
71% of their traffic was on mobile, converting at 0.47%, against 1.26% on desktop. Almost three times better, on a quarter of the traffic.
Everyone who looked at that read it the same way, and for a minute so did I. Mobile converts worse. It’s in every benchmark, and that reading is precisely why nobody went looking.
Why the benchmark was wrong about them
The gap was not normal. Their buyers are fleet managers and owner-operators, and the thing those buyers need settled before anything else is whether the part will physically fit. A 22.5 x 8.25 Alcoa looks identical in a photograph to one that won’t bolt onto their rig, because the difference is hub piloting versus stud piloting and not anything you can see. The specs were scattered across the page and missing entirely on a lot of products, while the page itself ran image, then title, then price, a layout that assumes the reader’s first question is whether they want the thing.
Their first question was whether it was the right one.
We built a dedicated spec section and changed the order: brand, part number and availability above the image, value propositions before price. Highest-revenue pages first, tested, read, then rolled out to the rest.
Over 56 days and 4,111 sessions, conversion went from 0.82% to 1.71% and revenue per session went from $14.82 to $24.49.
The benchmark wasn’t a neutral bystander in that story. It supplied the explanation that made an expensive and entirely fixable problem look like a law of nature, and it did so for months before anyone questioned it.
You can read the full Buy Truck Wheels breakdown here.
How to benchmark against yourself
Four steps, none of which require a new tool.
1. Fix your denominator before you compare anything. Conversion rate is orders divided by sessions, times a hundred, and the formula was never the hard part. Agreeing on what counts as a session is. GA4 and your store admin will usually disagree, often by a wide margin, because of how sessions time out, how cross-device visits get stitched together, and how bots are filtered. Pick one system, find out why the other one differs, and commit. A benchmark argument built on the wrong denominator is worse than having no benchmark at all.
2. Segment before you judge. A sitewide conversion rate is an average of averages, and it hides the thing you need to see. Split it by device and traffic source at absolute minimum. In Littledata’s current data the median is 1.5% on both mobile and desktop, but the top 20% of desktop stores clear 3.1% against 2.9% on mobile, so the gap lives in the tail rather than the middle. Split by industry and it is far starker: a 2.8% median in beauty and skincare against 0.9% in home and furniture, which has nothing to do with the quality of anybody’s site.
Then watch the two numbers together
3. Track revenue per session in the same report. Both numbers, every month, side by side. The month they move in opposite directions is the most useful signal you will get all quarter, and if you’re only looking at one of them you’ll miss it entirely.
4. Compare against your own trailing twelve weeks rather than against an industry table, because a trailing window is the only comparison that holds your seasonality, your price point and your traffic mix constant. If revenue per session is climbing against your own history then you’re winning, and where a published benchmark says you ought to be is genuinely irrelevant.
Across 3,000+ experiments, the programs that compound are the ones measuring against their own history. The ones that stall are usually chasing a number somebody read somewhere.
So what is a good ecommerce conversion rate
The one that’s higher than yours was last quarter, at the same or better revenue per session. Everything else is a description of somebody else’s store.
Which is better news than it sounds. It means you’re not behind, because there was never a line to be behind. The next useful thing you do doesn’t require more traffic, a bigger team or a new platform either. It requires picking one number that can’t be gamed, writing down where it sits today, and changing something big enough that you would be able to tell.
Frequently asked questions
What is the average ecommerce conversion rate?
Littledata’s benchmark of 427 Shopify stores puts the median at 1.4% for the ninety days to 10 October 2026. IRP Commerce measured 2.23% across UK and Irish merchants in August 2026. The figures differ because they measure different populations over different windows, not because either one is wrong.
What is a good conversion rate for ecommerce?
There’s no universal answer, because the right rate depends on your price point, your category and your traffic mix. A low rate on a considered, expensive product can be far healthier than a high rate on an impulse buy. Judge it on revenue per session against your own history.
Why do higher-priced products convert at lower rates?
Longer consideration cycles. Buyers compare, leave, research and come back, often across several sessions and more than one device. The rate is lower because the decision is bigger, not because the store is worse at selling.
Do conversion rates differ by industry?
Yes, but far less reliably than published tables suggest. IRP puts food and drink at 1.58% while Shopify puts food and beverage at 6.22%: same industry, different populations, four times apart.
How do I calculate my conversion rate correctly?
Orders divided by sessions, from one system, consistently. The common error is taking a figure from one platform and comparing it against a benchmark built on another platform’s definition of a session.
Is conversion rate the right metric to optimize?
Not on its own. It can be raised by discounting or by removing friction that was protecting your margin. Revenue per session captures both effects and is much harder to move in a way that quietly hurts the business.
Find out whether your rate is actually the problem
Most of the stores we audit don’t have the problem they think they have. Send us your conversion rate and your category and we’ll tell you whether it’s worth fixing, what to fix first, and whether you have the traffic to measure the fix.