This is an introductory article for people who are curious about machine learning.
Here are a few examples:
- Email spam filtering.
- Recommendation systems such as Netflix and Amazon.
- Predicting customer churn.
- Customer segmentation.
- Image recognition.
Develop Business Case
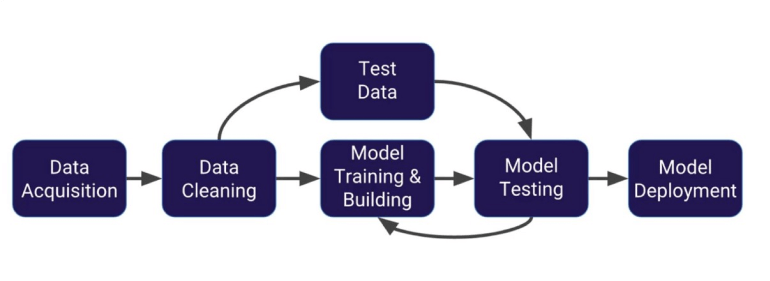
You also learn that most of a data scientists time is actually spent on acquiring, cleaning, and exploring data. Pradeep Menon of Alibaba Cloud estimates 80% of your time is spent there, while only 20% is on modeling, deploying, and evaluating.
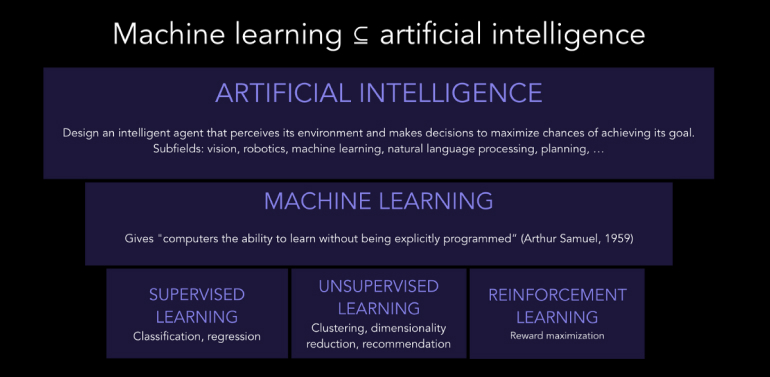
2. Unsupervised Learning.
3. Reinforcement Learning.
Acquire Data
import numpy as np
import matplotlib.pyplot as plt
import seaborn as sns
%matplotlib inline
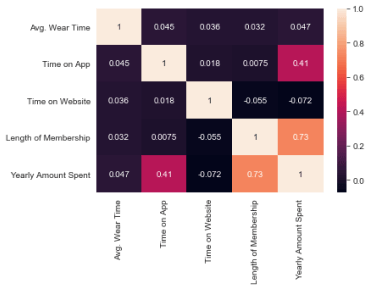
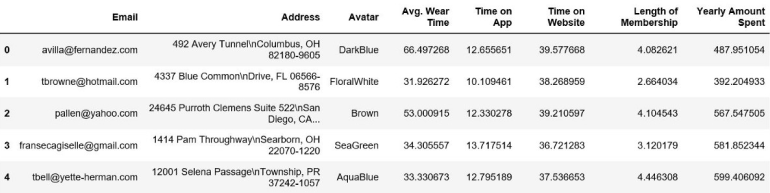
- Avg. Wear Time: Average time spent wearing glasses in minutes
- Time on App: Average time spent on App in minutes
- Time on Website: Average time spent on Website in minutes
- Length of Membership: How many years the customer has been a member
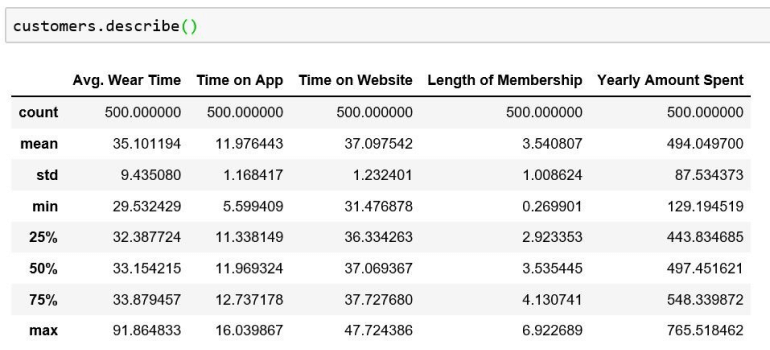
Clean and Explore Data
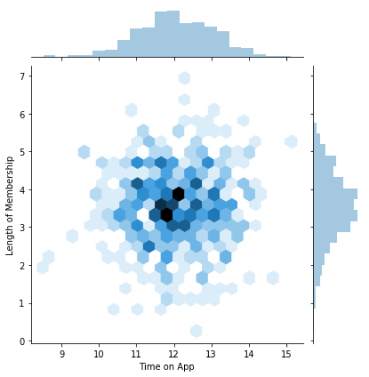
You might start by comparing the correlation of time on website and yearly amount spent.
sns.jointplot(x=’Time on Website’,y=’Yearly Amount Spent’,data=customers)
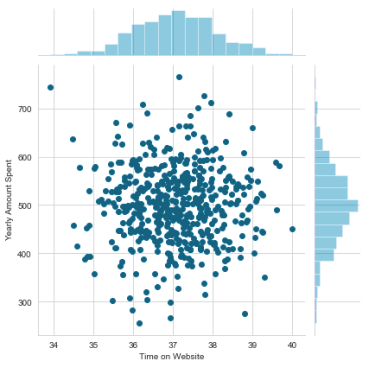
Linear plot using seaborn:
Train Model
from sklearn.linear_model import LinearRegression
X_train, X_test, y_train, y_test = train_test_split(X, y, test_size=0.3)
lm = LinearRegression()
lm.fit(X_train,y_train)
print(‘Coefficients: \n’, lm.coef_)
Coefficients:
[0.17825135 43.86015875 0.34813890 63.04039211]
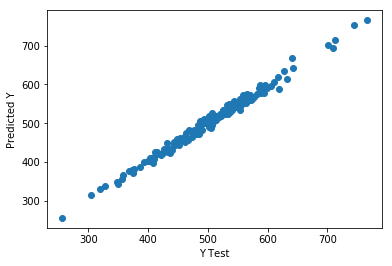
Predict Test Data
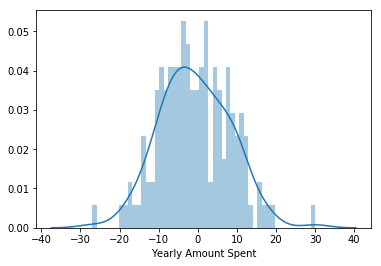
Evaluate Model
You can calculate the Mean Absolute Error, Mean Squared Error, and the Root Mean Squared Error as well as use a histogram to make sure the residuals are normally distributed. If you’re interested in learning more about these metrics, check out this link:
MSE: 78.97115165397457
RMSE: 8.71812066078243
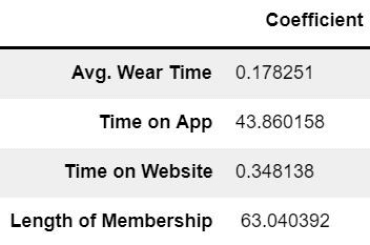
- Holding all other features fixed, a 1 unit increase in Time on App is associated with an increase of 43.86 total dollars spent. Similarly, this is how you would interpret the rest of the coefficients.